Your Project Is Telling You Something. Are You Listening?
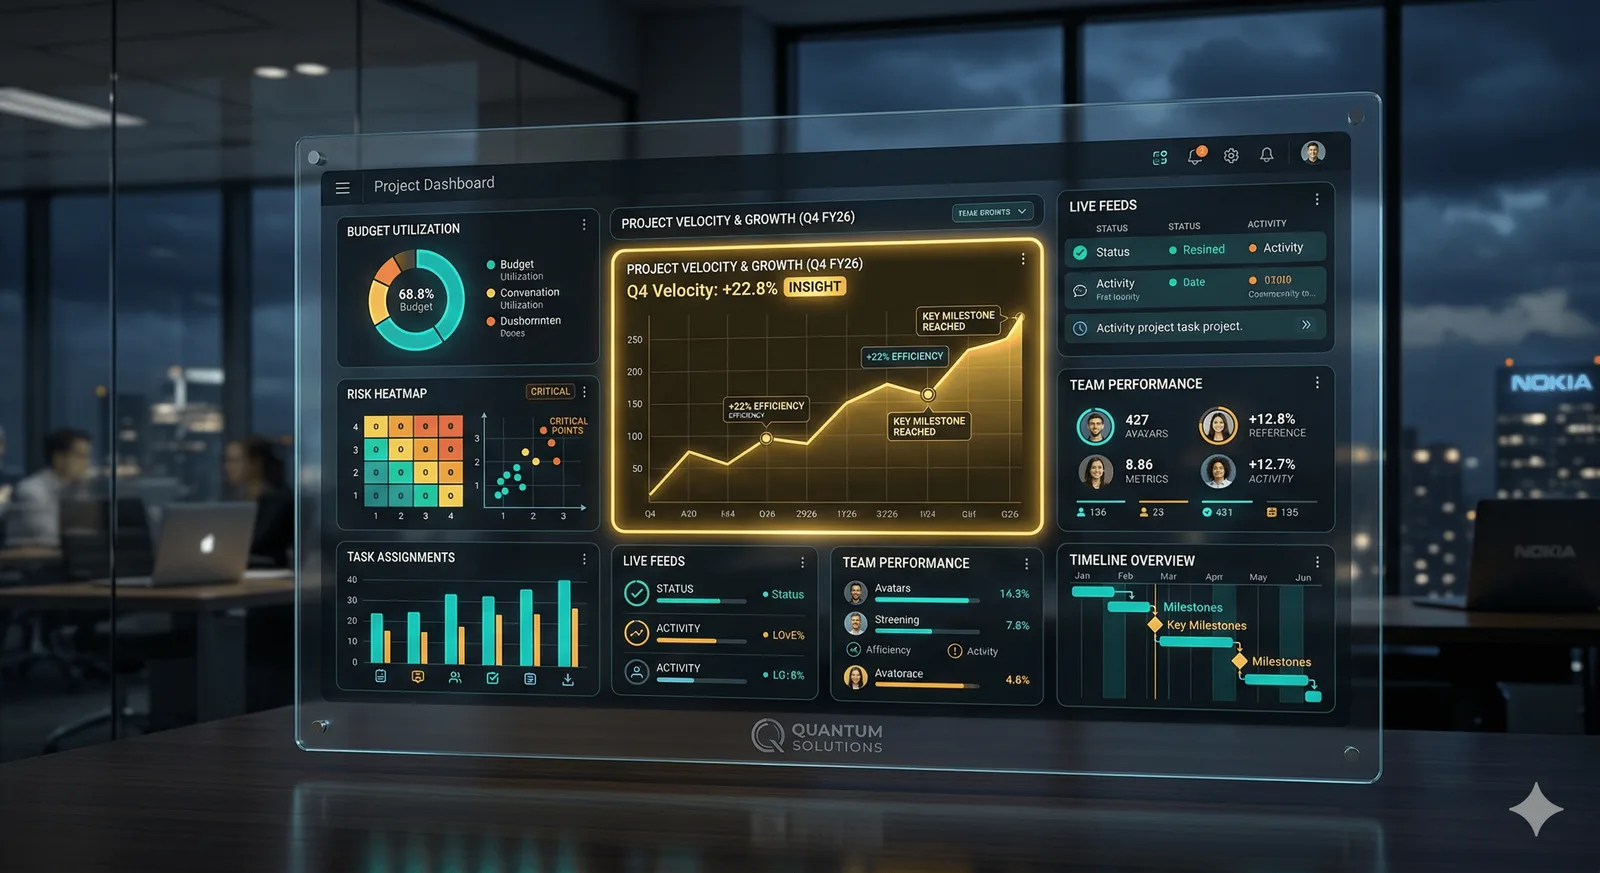
Every project produces more data than any one person can meaningfully process in the time available. Budget variance reports. Velocity charts. Risk register updates. Stakeholder survey responses. Retro outputs. Meeting transcripts. Change logs. Status histories. Most of it gets glanced at, filed, and never revisited - not because it isn’t useful, but because making sense of it takes time a project manager rarely has in the window between one governance meeting and the next.
This is the data paradox of modern project management. We have more information about our projects than ever before. And we are, in many cases, less able to act on it.
Analyse and Interpret is about using AI to change that ratio. Not to replace the PM’s judgement, but to ensure that judgement is applied to what the data actually says - not just what was visible in the thirty minutes available before a steering committee.
Reporting and Insight Are Not the Same Thing
Most of what project managers produce under the name of “analysis” is actually reporting. The numbers are current. The RAG status is accurate. The variance is documented. But the question the data is trying to answer - why is this happening, and what does it mean for the next six weeks? - often goes unasked, because the assembly work consumed the available time.
The shift from reporting to insight is one of the most valuable things a PM can develop. AI accelerates it - not by doing the thinking, but by handling the aggregation, pattern recognition, and first-pass synthesis that precedes it.
Feed a project’s data into an AI tool with the right question, and what comes back isn’t a report. It’s a set of observations with patterns highlighted, anomalies flagged, and a starting point for interpretation that would have taken significantly longer to produce manually. The PM still decides what it means. The AI just gets you to the question faster.
What Analysis Actually Looks Like with AI
Retrospective synthesis
Many organisations run retros faithfully but fail to connect them. The issues raised in sprint 3 and sprint 7 and sprint 12 might be symptoms of the same structural problem - a dependency that was never properly resolved, a communication gap between two workstreams, a process that works in theory and consistently fails in practice. No single retro surfaces this. Aggregating them does.
Here’s a practical example. Take the outputs from six months of sprint retrospectives - the raw notes, the themes, the action items. Paste them into NotebookLM or Claude and ask:
"What recurring issues appear across these retrospectives? Are there patterns
in what was raised but never resolved? What single change would have had the
most impact across this period?"
What comes back will not be the final answer. It will be a well-structured hypothesis that an experienced PM can validate, challenge, and act on - one that would have taken hours to produce manually.
Variance analysis
Budget and schedule data is often the most structured information a PM holds - and structurally it’s the easiest type to give an AI tool to work with. Paste your actuals table alongside the original forecast, add context on the delivery period, and ask the AI to identify where the project has consistently over or underperformed - not just last period, but as a trend across the project history.
The patterns that emerge from six months of data are often not visible in a single status review. A category that is five percent over budget in month one looks like a rounding issue. Five percent over in months one through six is a structural problem that the plan never accounted for.
"Here is my budget actuals table for the last six months alongside the
original forecast. Identify where we have consistently over or underperformed
against plan - not just for the last period, but as a trend. Flag any
categories where the variance is accelerating. Draft a two-paragraph narrative
explanation suitable for the governance report."
The AI returns the pattern. The PM determines what caused it - because the numbers don’t know whether the overrun is a pricing error, a scope change that wasn’t formally captured, or a systemic resourcing miscalculation. That interpretation is yours. The AI just surfaces the pattern fast enough for you to interrogate it before the meeting rather than after it.
Stakeholder sentiment analysis
This is a less obvious application, but a valuable one. If you have a library of stakeholder communications - emails, meeting summaries, survey responses - AI can identify shifts in tone, recurring concerns, and emerging themes that don’t surface in a single read-through. This is early warning intelligence. The kind that lets a PM address a stakeholder concern before it becomes an escalation.
Getting Your Data Ready
The step that most guides skip over: your project data is rarely in a clean state, and knowing how to prepare it makes the difference between a useful output and a generic one.
The good news is that preparation doesn’t require much. A few simple conventions make AI-assisted analysis significantly more reliable:
- Status reports: Paste as text. Include the date of each report at the top of each entry - this lets the AI track change over time, not just current state.
- Retrospective notes: A single document works well. Label each session clearly (e.g., Sprint 7 Retro - March) and include raw notes, not just the summarised themes - the detail is where the patterns live.
- Budget and schedule data: Paste directly from your spreadsheet. Keep the column headers. Add a short line of context: what currency, what time period, what the baseline represents.
- Stakeholder communications: Export email threads as text. Redact anything commercially sensitive. Group by stakeholder or workstream if you want the analysis to compare across relationships.
- Risk registers: Paste the full register with review dates. If you’ve kept version history, include it - AI can track how a risk has been rated over time and identify whether the trajectory is improving or deteriorating.
None of this is pre-analysis. It’s basic organisation that makes the analysis possible.
The Interpretive Loop
One thing worth naming explicitly: AI-assisted analysis is not a linear process. The most experienced users treat it as a dialogue.
A useful mental model is the interpretive loop:
- Feed - provide the data and a well-formed question
- Receive - the AI surfaces a pattern, anomaly, or hypothesis
- Challenge - test that hypothesis against your contextual knowledge. Is this a real pattern or a data artefact? Is this root cause or a symptom?
- Deepen - ask a follow-up question based on your read. “You’ve identified a trend in resource variance - can you look at whether this aligns with the periods when the external dependency was unresolved?”
- Synthesise - form your own interpretation, informed by but not determined by the AI’s output
The professional value is in steps three and four. That’s where your knowledge of the project, the team, the politics, and the history does the work that no AI tool can replicate. The AI provides structured material to think with. The thinking remains yours.
This also prevents a common pitfall of AI-assisted analysis: accepting the first output as the conclusion. It isn’t. It’s the starting point.
The Right Tool Depends on Where Your Data Lives
The tool landscape for this pillar is broader than it might appear, and the right choice depends primarily on what format your data is in.
Google NotebookLM is the standout tool for document-heavy analysis - project plans, status reports, risk registers, meeting transcripts, anything in narrative or structured text form. The concept is simple: upload your documents and interrogate them. Its particular strength is that it only draws on what you’ve given it - it doesn’t speculate beyond your documents, which is a meaningful advantage when specificity matters. There’s a dedicated article on NotebookLM coming soon for those who want to go further.
ChatGPT with Advanced Data Analysis (the data analysis mode) is the strongest option when your data is in spreadsheets or structured tables. It can read CSV files directly, generate charts, run statistical summaries, and produce narrative explanations of what the numbers show. For variance analysis and schedule performance data, this is the tool to reach for first.
Claude - with its long context window and Projects feature - handles extended document sets well. If you need to maintain a persistent project context across multiple sessions, upload your document library to a Claude Project and interrogate it over time as new data comes in. It works particularly well for synthesis tasks that require holding a lot of material in mind at once.
Microsoft Copilot (in Excel, Teams, or alongside your Microsoft 365 environment) is the natural choice if your data already lives in the Microsoft ecosystem. It brings the same analysis capability directly into the tools many PMs spend their day in, without the step of extracting and pasting data elsewhere.
The choice isn’t critical - start with whichever tool you’re already using. What matters is asking the question.
Presenting AI-Assisted Analysis Honestly
When AI-assisted analysis surfaces a pattern or a conclusion, it should be reviewed as a hypothesis, not a finding. The difference is small in language but significant in credibility. It should invite scrutiny and discussion.
If AI identifies that seven of nine retrospectives raised communication issues, the useful discipline is to ask: is this genuinely a systemic failure, or is it the natural background noise of delivery that appears in every retrospective regardless of project health? The AI can surface the pattern. It cannot tell you whether the pattern is signal or noise. That question requires your judgement - which is precisely why the interpretive loop matters.
What Changes When You Can Actually See the Data
The real benefit of the Analyse and Interpret pillar isn’t any individual piece of analysis. It’s the aggregate effect of a PM who is consistently working from a clear picture of what their project data is saying, rather than the subset of it they had time to look at.
Governance conversations change. Instead of a meeting that reviews what happened last period, you can hold one that examines what the trends suggest about next period. Risk management changes. Instead of maintaining a register that reflects what you already know, you’re identifying indicators of what might emerge. Stakeholder conversations change. Instead of responding to concerns after they’ve been raised, you’re occasionally ahead of them.
None of this requires a data science background. It requires the discipline to put the data in front of an AI with a useful question, and the professional experience to know what the answer means.
This is also where Analyse and Interpret begins to become something more than retrospective review. A PM who is consistently working from a clear picture of current project trends is, almost by definition, positioned to start looking forward - to anticipate what the data is suggesting about the next phase before that phase arrives. That’s where the fifth and final pillar takes over.
What data are you sitting on that you never have time to properly interrogate? It might not be the obvious kind. Your stakeholder email responses. Your risk register revision history. The meeting transcripts from the last six governance sessions. The pattern is probably in there. You just haven’t had the time - or the tool - to look for it yet.
Yes, AI helped me to write this :)